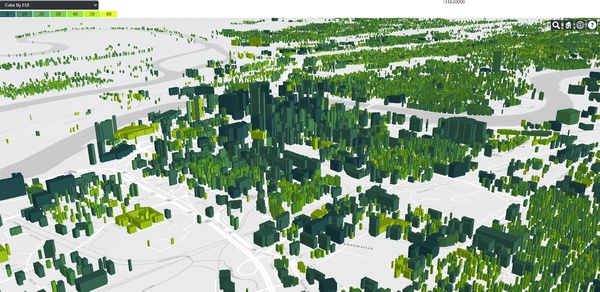
This Article was Contributed by Eddie Oldfield, Senior Lead, Projects & Advisory Services, QUEST; Jessica Webster, Energy Planning Analyst, Natural Resources Canada; and Ryan Ahola, Environmental Scientist, Natural Resources Canada –
Introduction – The Challenge
Building energy mapping and analysis are critical for geo-targeting energy policies and programs to accelerate the transition to a low-carbon built environment and economy. Efforts to map energy use and greenhouse gas emissions from buildings are undertaken by Canadian municipalities for energy and emissions planning purposes, supported by consulting firms, universities, and sometimes non-profit organizations. Energy mapping projects are conducted independently at different times, across different scales, and using different methods and assumptions. Yet fundamentally, the data are the same: what’s required is an understanding of the building stock and its energy-related attributes including the number of buildings and units, their respective floor areas, as well as measured historical energy use and modelled predicted energy use based on different housing or building types (known as archetypes). Despite this commonality and everyone’s best efforts, there is little coordination across initiatives and no best practices or standards widely in use. This results in duplication of effort, lost energy savings, and lost opportunities for decarbonization, climate change mitigation, and climate resilience.
The Building Energy Mapping and Analytics Concept Development Study (BEMA-CDS) addressed the challenge posed by this situation by:
- Characterizing the state of development of energy mapping and analytics for the building stock broadly; and
- Informing IT architectural practices and standards to enable mapping and analytics specifically of residential energy use and efficiency.
Study launch + what was done
Initiated in December 2019, with support from Natural Resources Canada (NRCan), the study drew from a number of information sources, including past research and public consultations, relevant legislation, and ongoing related initiatives. It then developed and, in February 2020, publicly released a Request for Information (RFI) that solicited responses from a wide audience of stakeholders and organizations. Questions were posed in eight subject categories concerning the building energy mapping and analytics domain.
It targeted three principal scenarios for development and application of building energy analytics and mapping:
- Community Energy and Emissions Planning
- Utility Conservation Potential Review & Demand-Side Management Program Planning
- Federal/Provincial/Territorial Building Energy – Policies, Programs, Standards, Building Codes
A series of webinars were held in mid-2020 with RFI respondents and OGC Energy and Utility Domain Working Group members to review and workshop the responses provided, to arrive at a refined understanding of current practice, and provide input to the notional architecture.

Who Can Benefit from this Study?
The report documenting the BEMA-CDS focuses on issues surrounding data sharing and spatial data interoperability that currently stand in the way of more fully achieving the goals and value of building energy analysis. This valuable perspective benefits many stakeholders and programs, including:
- Building scientists and energy researchers
- Suggests paths to improved data interoperability, better models, increased coordination
- Identifies potential approaches for reducing duplication, time, and costs across organizations
- Supports better quality control, and comparable data for planning and program evaluation
- Government policy analysts, regulatory authorities, and building codes and standards committees
- Identifies new approaches to inform national and provincial housing retrofit incentive programs
- Anticipates data interoperability challenges and opportunities around Alterations Codes for existing buildings
- Community energy planners
- Municipal energy planning, including design and delivery of housing efficiency programs
- A geospatial view offers the possibility of improved coordination with utilities through a common operating picture
- Utility demand-side management program managers
- Anticipates need for more geospatial analysis as more renewables come online; capital cost offsetting
- Points to “behind the meter” methods that could improve uptake for conservation and demand management (energy efficiency) programs
- The OGC Energy and Utilities Domain Working Group (DWG)
- Supports identification of potential further R&D and standards development activities beyond the timeframe of the BEMA-CDS study, for example those that address the evaluation of decarbonization strategies.
This emerging discipline sits at the convergence of many domains and areas of professional knowledge including building science, geospatial science, data science, urban planning, and energy planning. Consequently, beyond the priority usage scenarios and specific stakeholders identified above, the BEMA-CDS will also be of interest to anyone working to advance smart cities, urban digital twins, building stock energy modelling, and/or the smart grid (sometimes referred to as the digital grid). An emerging cleantech segment known as climate tech – cleantech companies tackling climate change specifically – will also be interested if their solutions relate to energy and buildings, as will venture capitalists seeking to invest in climate tech firms. Banks, who increasingly view climate risk as lending risk, should be interested in geospatial approaches to quantify the carbon-intensity of their mortgage portfolios and support assessment of lending products for energy efficiency and renewable energy technology deployment.
Some Key Findings
A critical challenge and a need identified in this study is the availability of the right spatial information elements to perform building energy analysis at various levels of generalization and specificity to improve lives and advance community goals. Across building energy mapping efforts, repetitive and non-standardized methods are used to collect, exchange, and integrate datasets. Some notable examples of persistent mapping undertaken at regional or national scales include the CityGML work in Berlin, ORNL’s digital twin AutoBEM, and the UCLA Energy Atlas. The current ad hoc approach to data collection, integration, and re-use is terribly inefficient in face of the current climate crisis.
The idea of supporting reusability and sharing of spatial data by building information as infrastructure has been around for many years under the concept of Spatial Data Infrastructures (SDI). Canada has a highly developed SDI, the Canadian Geospatial Data Infrastructure (CGDI), which uses a distributed model to support access, sharing, and use of diverse spatial information. CGDI provides critical infrastructure that Canadians rely on every day, such as weather forecasts produced by Environment and Climate Change Canada. CGDI also supports future-oriented research by allowing scientists to integrate many different forms of information through location, such as within climatedata.ca.
More recently, the concept, capabilities, and design of such infrastructure have been expanding in the age of cloud computing. It makes sense in this context to consider what an “energy Spatial Data Infrastructure” (eSDI) might look like that can support diverse building energy data needs, opportunities, stakeholders, and goals identified in the report.
Challenges Identified
Other common challenges enumerated by RFI respondents – and later reaffirmed by workshop participants – related to data availability, privacy, and confidentiality, as well as considerations concerning proprietary formats. Data source methods and confidence were found to be wide-ranging and poorly documented, variously measured, modeled, inferred, estimated, and assumed. A lack of access to cost estimates for retrofits was identified by respondents as a barrier to deriving benefits from energy mapping and modeling data. From a data infrastructure and reusability perspective, the lack of an overarching data framework prevents connecting the scale and resolution of spatial data to particular use scenarios. Similarly, there are no accepted schemas for applying different archetyping approaches (clustering/classification) to different use-case scenarios and levels of organizational technical and financial capacity.
Opportunities Identified
Despite these and other challenges, numerous opportunities were identified in the study, including data access technologies that account for privacy, confidentiality, and anonymity. Promising techniques include enclave processing, anonymization by aggregation, and noise injection, sometimes referred to as differential privacy. Adaptive classification and archetyping based on sample modeling is another potential approach to fit archetyping needs to use-cases using available data. The development of national systems for consistent energy data at multiple spatio-temporal scales is identified as an opportunity that could serve a range of use-cases. National building data for comprehensive analysis of building types, energy performance, retrofit/upgrade technologies, costs, and benefits was another data-related opportunity identified. In support of greater data interoperability, opportunities around data sharing policies and standards can be organized to support critical use-cases and stakeholders, for example mandated reporting and federated contracts. Community/utility cooperation facilitated by regional or national authorities may allow stakeholders to better understand opportunities, costs, and benefits of new technologies and energy sources including renewables.
Notional Architecture of Energy SDI
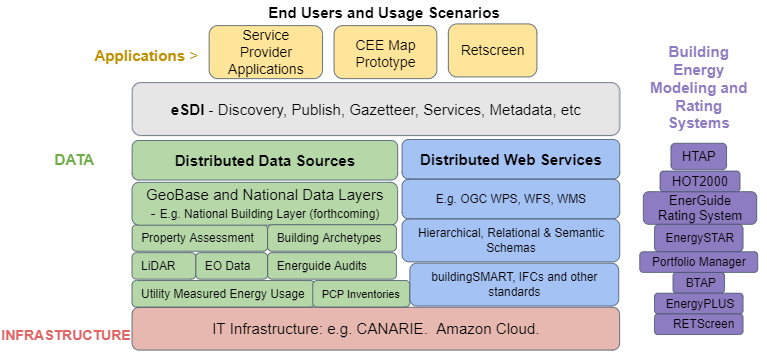
One main output of the BEMA-CDS is what’s referred to as a “notional architecture for an eSDI.” Reflecting the architecture of all spatial data infrastructures, it is organized into broad categories, also known as tiers. On the below diagram, these can be seen on the left-hand side, starting at the bottom with data and moving up to computing, services, and applications. This architecture follows the evolution of information, from data through processing to decision support. Each line to the right of the four tiers contains generic packages that apply to the energy and buildings domain. At the top of the architecture, applications synthesizing and presenting the resulting information are shown to potentially fulfil a range of auditing, program, policy, educational, and commercial decision-support functions.

A notional architecture for an energy Spatial Data Infrastructure (eSDI)
Further to the notional architecture, the below diagram illustrates the current context in Canada. Existing data sources, standards, and applications are not fully interoperable with current energy modelling, benchmarking, and labelling platforms in common use. These platforms use and collect data that is spatially implicit, that is having spatial attributes such as address, city, or weather region. However, the full power of spatial data interoperability, mapping, and spatial data analytics is not fully architected, operational, or available to Canadian energy decision makers.
The study and notional architecture help to inform conversations about the potential value and opportunities to undertake further eSDI architecture development – in Canada and abroad. For example, some elements such as hierarchical, relational, and semantic schemas have yet to be developed.

Next Steps
Among the many issues raised, the below learning opportunities and potential next steps stand out:
- Design of an extensible and standardized national building layer, leading to both national application and improved comparability of promising building energy analysis methods.
- Sandbox activities such as interoperability pilots, modeling the mutual benefits of information sharing and data interoperability.
- Prototypes for an eSDI, demonstrating common availability of such technologies as cloud-based energy modeling, model-driven building archetypes, and enclave protocols for addressing data privacy and proprietary constraints.
- Development of energy poverty indices that take into account fine-scale socio-economic, climate, and geographic factors in assessing the impacts and mitigation of building energy costs.
These activities can take the form of data development initiatives and interoperability experiments, which in turn can contribute to standards development. In any of these activities, cross-cutting themes can be explored and elaborated, including matching spatial-temporal resolution of input and output data, and archetyping methods matching to use-cases.
Conclusion
The BEMA-CDS study enumerates the current state of practice and identifies challenges and opportunities in building energy mapping and analytics. It also sketches out for the first time a notional architecture for an energy Spatial Data Infrastructure. Shifting effort and resources from a mindset of “let’s just get it done for this project” to one of “build it, maintain it, and continuously improve it” would produce efficiencies, improve the quality and timeliness of decision support, and accelerate innovation and job creation in the domain – all on top of cost savings and a reduction in GHG emissions. Urban digital twins, such as AutoBEM, developed and maintained by Oak Ridge National Laboratory, or Virtual Singapore, developed by the National Research Foundation, are leading examples of what can be accomplished with this mindset and current technology.
The Building Energy Mapping and Analytics: Concept Development Study Report was recently published and is freely available on the Building Energy Mapping and Analytics Concept Development Study (BEMA-CDS) page.
The authors welcome any questions concerning the study or report:
- Eddie Oldfield (Senior Lead, Projects & Advisory Services, QUEST) eoldfield@questcanada.org
- Jessica Webster (Energy Planning Analyst, Natural Resources Canada) jessica.webster@nrcan-rncan.gc.ca
- Ryan Ahola (Environmental Scientist, Natural Resources Canada) ryan.ahola@nrcan-rncan.gc.ca
